Profiling Multi-Core Applications
A while ago, I wrote an article about writing parallel programs. The next question is: how do you optimize them?
Note: if you are writing multi-core programs and are coming to NIWeek, please email me (email address on the right). I'd like to talk to you about this topic further. But I digress...
Typically, when optimizing an application, you are trying to make it faster. "Faster" usually means "reduce the time the user observes the task to take". We sometimes call that "wall clock time". Occasionally, there is no outside observer. Instead, you want your task to be less of a disruption on other applications. In that case, you are purely concerned with how much of the resources of the computer, typically the CPU, are being consumed. This consumption could be called "CPU time".
When optimizing for wall clock time, you quickly run into some difficulties.
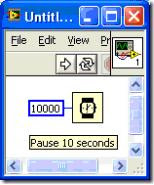
1) Most profilers give you time of operation in CPU time. A function that goes to sleep for 10 minutes has a CPU time of nearly nothing but a wall clock time of 10 minutes.
For example, if you run this VI with the LabVIEW profiler enabled, it will show that it uses a whopping 46.9 milliseconds
So, you think. Wow, my application took 10 seconds and this function only took 47 milliseconds, I guess my slowdown is elsewhere. And, of course, you would be wrong. Now, this example is pretty silly. No one just adds a sleep for the heck of it. Normally, you'll find "sleep time" in a couple of different places- Pausing because you need to synchronize with other event. Maybe you go to sleep for 1 second until some external piece of hardware has responded.
- Calls into the OS. Reading from disk and writing from disk occurs in the OS. The CPU time returned by the profiler doesn't normally show time spent in the OS, even though it is consuming CPU cycles.
- Calls into a driver. Some driver calls do their work inside the OS so they are a case of #2. Or, sometimes they get implemented as a LabVIEW sleep, and so they also don't get counted.
- Task swaps. The OS might decide to give some other application some time. This hurts the wall clock time of your application but your profiler won't tell you.
If you want wall to measure wall clock time, you should instead get the tick count of the machine before and after the operation occurs. A tick count uses wall clock time to give you the results. My profiling article shows you how to get the tick count to profile an operation.
2) Things get a bit weirder when you want to try and optimize on a multi-core computer. On a single core machine, you can make your program run faster by either reducing wait time like you saw in #1 or by reducing the CPU time. On a multi core machine, a task can have a shorter wall clock time even though the CPU time and wait time are the same. If you split the CPU work (i.e. CPU time) evenly across two processors, your wall clock time goes down by a factor of 2 but your CPU time is the same.
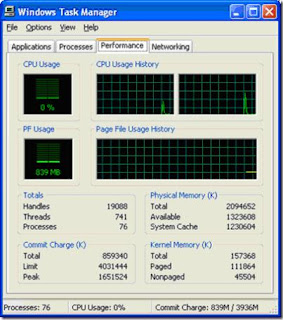
You can observe this with the Windows task manager. If you have two cores, the task manager will show two graphs of CPU utilization, one for each CPU. You can also use the windows application "perfmon" which gives you a bit more flexible way to observe this.

(the CPU Usage History shows 2 graphs, one for each processor)
So, to optimize your application, the trick is to max out both processors. In effect, you are trying to INCREASE the CPU time for the second processor by shifting the processing from CPU 1 to CPU2. It's odd to think of optimizing as increasing processor time, but that's what you are doing.
The problem with using this approach is that increasing the CPU time on the second processor doesn't necessarily reduce wall clock time. Your efforts to make your application more parallel might add CPU work, such as forcing memory copies, that negate the benefit of parallelism.
As an example, the old LabVIEW queue primitives used to copy data into and out of the queues. If you put a big array in a queue, it would spend a lot of time copying the array into the queue and then a lot of time copying it out. To make my application more parallel, I split it into loops and used queues to pass the data between the loops. My CPU utilization was great, 100% on both cores, but my wall clock time was slower because it spent a long time simply copying data around. Fortunately, we learned from that experience and the primitives don't make copies of arrays & clusters any more.
Unfortunately, there's not a really good way to look at this effect right now. Use tick counts to measure your wall clock time and use the profiler to establish a baseline. Then, as you are making changes, make sure the wall clock time is going down and the CPU time is remaining at least constant or only going up slightly.
Labels: LabVIEW, MultiCore, ParallelProgramming, Profiling


0 Comments:
Post a Comment
<< Home